Vision Inspection AI: Have You Decided What You Are Measuring? Resolution Limits and Measurement Variation (2)
A vision inspection AI cannot find anything smaller than what its camera can see, and if human judgments are inconsistent, it learns that inconsistency too. Part 2 covers working back from the smallest defect to the resolution you need, checking the measurement system first with Gage R&R, evaluating parts near the pass/fail line separately, and a pre-adoption checklist, with cases from Korea and abroad.
No model can find what the camera cannot see. And an AI taught with a wobbly ruler learns the wobble too.
With the definition set, it is time to measure the limits
Part 1 covered writing down what you measure and tying the reference instrument and units together. Once the definition is in place, two questions follow: how small a thing can this camera see, and how much does the current measurement vary?
Both can be answered before you choose an AI model. Put them off, and after the pilot you will hear the conclusion that "the AI can't catch this defect." Finding out at that point that the cause was the lens or the judging criteria makes the fix far more expensive.
Three. Calculate the smallest thing the camera can see
In vision inspection, resolution is not a performance option but a physical condition that sets the measuring range. Anything smaller than the real-world area one pixel covers cannot be seen by any model.
The machine vision rule of thumb is simple. The Imaging Source's glossary, from the camera maker, says presence checks need 1 to 2 pixels, dimensional measurement 3 to 4 pixels, and barcode or character reading 3 to 5 pixels per finest element. These numbers are the floor for "visible." If you need to measure size within a few percent of error, you need many more pixels.
| What you want to do | Pixels the smallest target must cover |
|---|---|
| Presence check | 1 to 2 pixels |
| Dimensional measurement | 3 to 4 pixels |
| Barcode or character reading | 3 to 5 pixels per finest element |
| Measuring size within a few percent | Far more than the above |
After resolution come installation and calibration. If the camera is not parallel to the target, magnification varies across the frame, and a single reference object will hardly reveal that tilt. When lighting changes, edges shift, and humidity or dust can push readings up.
Environmental monitoring is a good example. Low-cost particulate sensors used in Korea measure concentration from how much light scatters off particles, and they have a known limitation of being affected by humidity and other non-particulate factors (in Korean). Korea's Ministry of Environment runs a performance certification scheme for these sensors. According to a 2023 report (in Korean), of the 430 certified models, 223 received grade 1 and 207 were ungraded, based on accuracy and other criteria. Since the same air yields different numbers depending on the device and installation, grades are attached to the devices so that users know what they are getting.
Before adoption, calculate three things: how many pixels the smallest defect you must find covers, how uniform magnification is across the camera's field of view, and whether the range you will miss as a result is acceptable for the business. If the answer to the last question is "no," the fix is not a different model but a different camera position or lens.
Four. Check the measurement system before the AI
Before asking about AI accuracy, measure how much the current measurement itself varies. Manufacturing quality already has a procedure for this: measurement system analysis (MSA), and within it, repeatability and reproducibility assessment (Gage R&R).
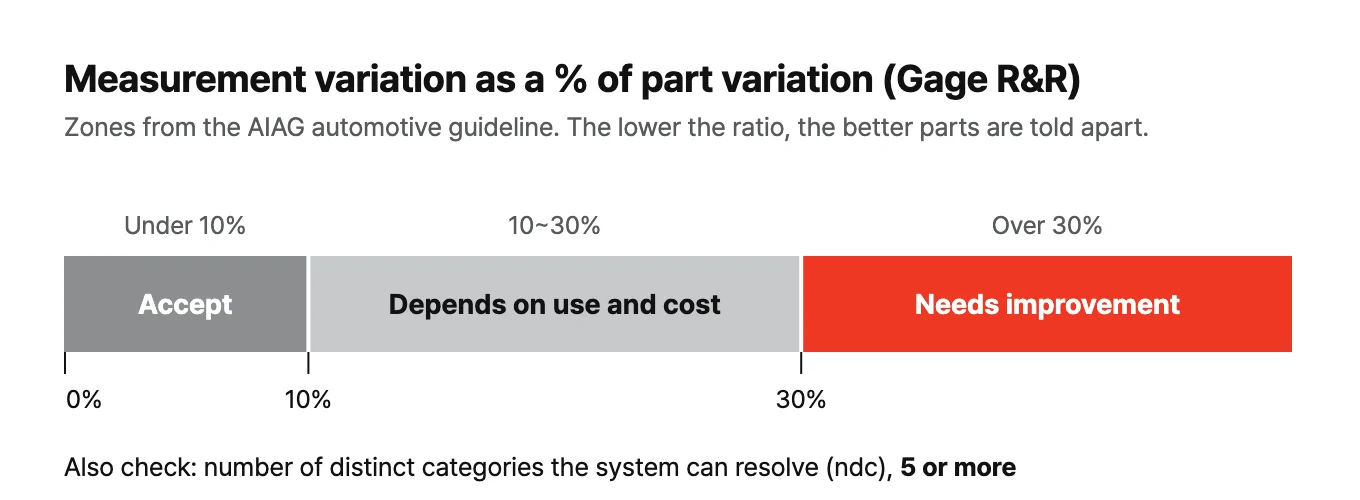
Here is how it works. Pick about ten parts and have several inspectors each measure them several times. Then see how large the variation in measurements is compared with the actual differences between parts. According to the automotive industry guideline (AIAG) as summarized by Minitab, a ratio under 10% means the measurement system is acceptable, 10 to 30% calls for a judgment based on application and cost, and over 30% means it needs improvement. You also check whether the number of distinct categories (ndc) the system can resolve is 5 or more.
Why this matters for AI becomes clear once you think about ground-truth labels. AI learns from judgments made by people. If those judgments differ from person to person, the AI is trained with a wobbly ruler. In an interview with IEEE Spectrum, Andrew Ng said it is very common, across vision, speech and natural language, for human labelers to be unable to agree on the right label. In his example of inspecting phone casings, scratches, dents, pit marks and discoloration are all mixed together. He explains that finding where the data is inconsistent and focusing on fixing it was the more efficient path to a well-performing system. In many cases, keeping the neural network architecture fixed and fixing the data is the more productive move.
In practice, have two or three inspectors judge the same 100 photos independently. If agreement is low, revising the judging criteria comes before adopting AI. The revised criteria become the AI's answer key.
Near the pass/fail line is where the risk is
Measurement variation turns into concrete losses on the floor, and those losses occur near the pass/fail line.
Consider a part whose spec is 10.00 mm or less. If measurements vary by ±0.05 mm, a part that is actually 9.97 mm can read 10.02 mm and be rejected, and a part that is actually 10.03 mm can read 9.98 mm and pass. Parts far from the line cause no trouble. The problems always cluster at the boundary.
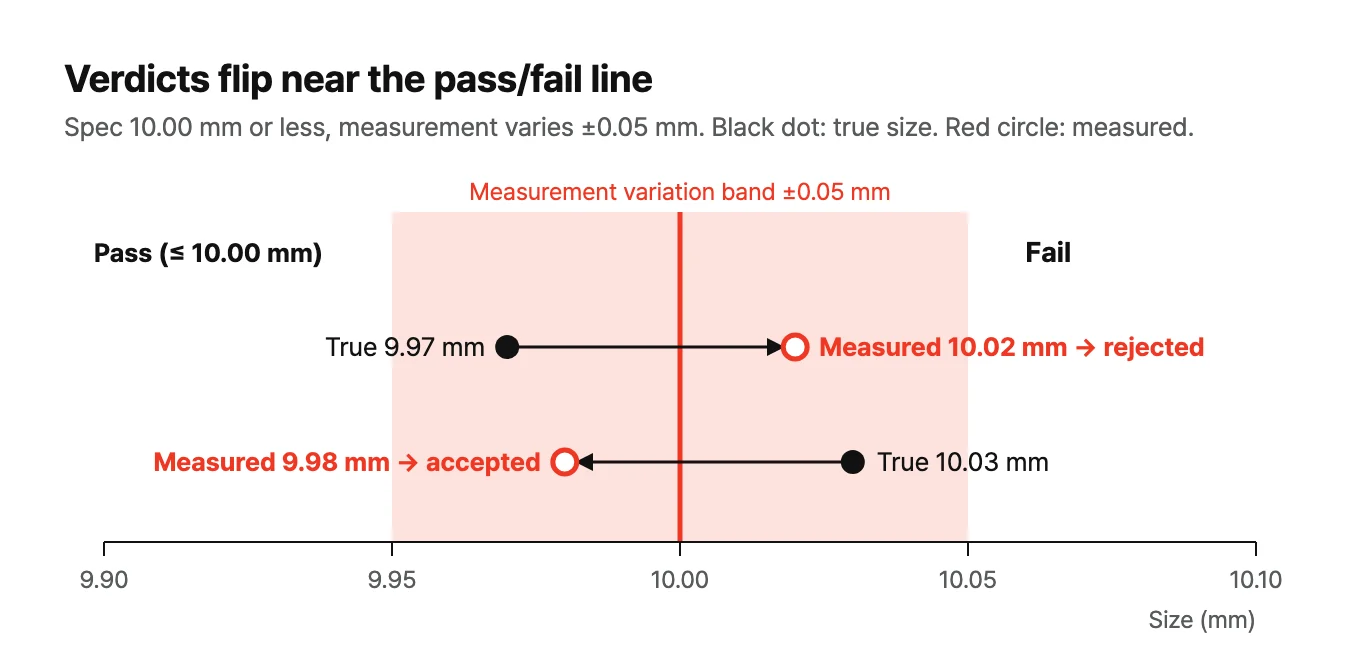
So when you evaluate a vision inspection AI, look separately at how well it does on parts near the pass/fail line rather than at overall accuracy. Test only on samples that are clearly good or clearly bad and accuracy will look high, but what actually needs judgment on the floor is product sitting on the boundary. If measurement variation near the boundary is large, you have two options: make the measurement more precise, or set a guard band inside the pass line and have a person re-check products in that band.
Pre-adoption checklist
Before you request a vision inspection AI quote, check that you have answers to the items below. The first three come from Part 1; the rest are from this part.
- Measurement definition: Have you written down, with a drawing and sentences, what you measure, on which face and in which direction?
- Reference instrument: Is there a single designated instrument or judge to check AI results against?
- Unit labeling: Do the numbers in your reports carry the instrument, definition and counting basis?
- Minimum size: Have you calculated how many pixels the smallest defect you must find covers?
- Installation conditions: Have you tested how much the numbers change when camera tilt, lighting or distance changes?
- Measurement variation: Have you first measured the repeatability and reproducibility of human judgments and the existing instruments?
- Blind spots: Have you documented what this setup will miss?
Answering these seven usually takes days, not weeks. And only with these answers can you ask what the "99% accuracy" line in an AI project quote really means.
In summary
Calculate the limits of what the camera can see, measure the variation in the measurement itself first, and evaluate the area near the pass/fail line separately. Then, when you ask about AI accuracy, you can trust the number.
When pilot results fall short of expectations, retrace this sequence before blaming the AI. How to verify and read results is covered in the AI verification design post, and how to measure outcomes after adoption in the measuring AI results post.
I wrote up a hands-on experiment on this topic in Sieve, Laser, Camera: Why Three Answers?.
Series: "Vision Inspection AI: Have You Decided What You Are Measuring?"
- Defining size and choosing a reference instrument
- Resolution limits and measurement variation (this post)
References
- The Imaging Source, Image Resolution in Machine Vision
- 메트로신문, 부산항만공사 미세먼지 간이측정기 성능점검 (2024) (Metro Seoul, Busan Port Authority performance check of low-cost particulate sensors; in Korean)
- 메트로신문, 미세먼지 간이측정기 성능점검 의무화 (2023) (Metro Seoul, mandatory performance checks for low-cost particulate sensors; in Korean)
- Minitab, Is my measurement system acceptable?
- IEEE Spectrum, Andrew Ng: Unbiggen AI (2022)